|
|
GEOG 1011
|
| OBJECTIVES: | (a) to use the worldwide web to access streamflow data; |
| (b) to compare precipitation/runoff characteristics of rivers in differentregions. |
BACKGROUND: The National Weather Service (NWS), the US Geological Survey (USGS), and various other federal and state agencies in the US share the responsibility of collecting, reporting and maintaining hydrologic data. There are literally thousands of precipitation and streamflow-measurement stations across the country. Some of these stations have been in operation for over 100 years and they record data at frequent intervals (e.g. every 15 minutes). As you can imagine, vast amounts of hydrologic data are available, and these data can be used for a variety of purposes.
DATA: The USGS maintains a comprehensive web site that provides information on current streamflow conditions, summaries of recently published reports, and access to historic streamflow and water quality data. The address of the USGS water resources site is:
ASSIGNMENT:
You may print out this assignment and answer the questions in the spaces provided, OR to save paper, you may simply answer on a separate piece of paper, clearly identifying the question number, e.g. 1a) 1b) ..... 6a) 6b) and so on.
You will need graph paper to complete this assignment.
Be sure to include:
HINT: Open TWO WINDOWS in Netscape Navigator (or the web browser of your choice) and keep the assignment in one. In the other use the assignment as a base for links to soils websites. This will allow you to have the questions available as you look at the reference sites.
1. a) Open the USGS water resources website
http://water.usgs.gov/
b) Select the link to Real-Time data
http://water.usgs.gov/realtime.html
c) Place the cursor in the center of the state of Arizona and click.
d) Now click on "Statewide Streamflow Table"
e) A listing of current streamflow conditions in Arizona should appear;
f) select the link for the COLORADO RIVER near LEES FERRY (09380000). How do
you explain the flow fluctuations at this location?
2. Using the USGS website graphing capabilities, plot hydrographs for the given locations and dates. Use the information in the table below for parts "a" and "b".
Return to http://water.usgs.gov/
and go to the top of the page. Click on NWISWeb Water Data
which is listed near the top.
At the top-right of the page click on Data Category
and select Surface Water.
Or, simply scroll down the left side of the page and select Surface Water ;
two ways to get to the same place.
A page with the title "Surface-Water Data for the Nation" will appear.
Click on "Streamflow" from the column on the left.
There is some geographic data that come up.
Follow the instructions for select state to select "Colorado".
Find the Station ID # for the Yampa River in the table of gaging
stations for Colorado that appears (listed in the below table)
and click Submit. On the next page, type in the starting and ending
dates for the Yampa River (listed in the below table) and change the Graphs
of Data from a log scale to an arithmetic scale. Click Submit
and answer question #2a.
| NAME | STATE | STATION ID | START DATE | END DATE |
|---|---|---|---|---|
| Yampa River nr. Steamboat Springs | CO | 09239500 | 1995-04-01 | 1995-06-30 |
| Merced River nr. Happy Isles | CA | 11264500 | 1996-12-29 | 1997-01-07 |
a. For the Yampa River, considering the dates, the station description,
and the shape of the hydrograph, what do you think is causing the increase
in discharge?
*(don't be afraid to surf around and gather as much information about this
station as you can, such as the station site map)
b. Follow the same procedure as you did for part "a" of this question. The only difference is that you are now producing a hydrograph for the Merced River located in California. For the Merced River, how many more cubic feet per second was flowing on January 2 than on December 31? What sort of event do you think could cause such a dramatic increase in discharge so rapidly? *(Think about what time of year it is and locate the station site map. Is this area found in the high country or the low country?)
3. In addition to streamflow and water quality data, the USGS provides information on drainage basin characteristics (e.g. drainage area, average elevation, channel gradient, mean annual precipitation, percent forest cover, etc.) for many streams and rivers. These data can be used to develop relations for streamflow and floods in basins where there are no gauging stations.Table 1 below lists flow and basin characteristics for 12 high-elevationstreams in Colorado.
Table 1. Values of mean annual flood (MAF), drainage area (DA), mean annual precipitation (MAP) and average channel slope (SLOPE) for 12 streams in the Rocky Mountains of Colorado.
| RIVER | USGS STATION # | MAF (cms) | DA (km2) | MAP (cm) | SLOPE (m/m) |
|---|---|---|---|---|---|
| NF Michigan River | 6616000 | 5.2 | 55 | 66 | 0.040 |
| Clear Creek | 6716500 | 30.0 | 376 | 66 | 0.051 |
| S St. Vrain Creek | 6722500 | 7.0 | 37 | 76 | 0.051 |
| M Boulder Creek | 6725500 | 13.3 | 94 | 69 | 0.060 |
| Big Thompson River | 6733000 | 30.7 | 355 | 72 | 0.039 |
| Poudre River | 6747500 | 57.5 | 515 | 69 | 0.021 |
| SF Poudre River | 6748600 | 15.2 | 234 | 70 | 0.015 |
| Colorado River | 9011000 | 20.9 | 264 | 70 | 0.015 |
| Fraser River | 9024000 | 9.7 | 71 | 79 | 0.006 |
| SF Williams Fork | 9035900 | 7.9 | 71 | 83 | 0.037 |
| Williams Fork | 9036000 | 29.2 | 231 | 83 | 0.035 |
| Snake River | 9047500 | 15.4 | 149 | 91 | 0.051 |
a) Suppose you are hired by the Summit County Planning Department todevelop a simple relation for estimating the discharge of the mean annualflood (MAF) on an ungauged stream. You suspect that the MAF can be estimatedby knowing either the drainage area (DA), mean annual precipitation (MAP)or slope, as listed in Table 1. On a piece of graph paper, plot two graphsshowing (1)the relation between DA and MAF, and (2) the relation betweenMAP and MAF.On the basis of these graphs, which of the two variables- DAor MAP- is betterfor predicting the MAF?
b) Figure 1 below shows the relation between MAF and SLOPE for thesebasins. If anything, it looks like the MAF decreases as SLOPE increases.This doesn't make sense. Can you explain?
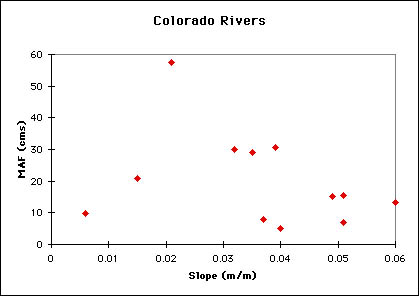
Figure 1. Relationship between Mean Annual Flood and SLOPE.
4. Precipitation data are collected and maintained by the National Weather Service. Data from weather stations in Colorado can be retrieved from the Office of the State Climatologist in Fort Collins. To access these data go to the following address:
http://www.wrcc.dri.edu/summary/climsmco.html
"Note that you can obtain a variety of information from this site. To retrieve weather data click ["Boulder and Winter Park from the list of weather stations along the left side"] Complete the following table with information from these two weather stations."
|
BOULDER |
WINTER PARK |
|
| STATION |
50848 |
59175 |
| AVERAGE ANNUAL PRECIPITATION (1942-1997) | ||
| WETTEST MONTH | ||
| AVERAGE ANNUAL SNOWFALL (1942-1997) | ||
| SNOWIEST MONTH |
5. Table 2 compares NWS measurements of annual precipitation in Nederland, CO, with USGS measurements of discharge in Middle Boulder Creek (also inNederland). On a piece of graph paper, plot the values of MAQ and MAP foreach year; use separate scales on the left and right of your graph for they-axis valuesof MAQ and MAP. Answer the following questions:
Table 2. Comparison of mean annual precipitation (MAP) at Nederland,
CO
and mean annual discharge (MAQ) of Middle Boulder Creek, 1971-1986.
|
MAP (cm) Nederland |
MAQ (m3/s) MiddleBoulderCreek |
|
| 1971 | 46.5 | 1.93 |
| 1972 | 43.9 | 1.37 |
| 1973 | 53.2 | 1.62 |
| 1974 | 39.7 | 1.68 |
| 1975 | 41.8 | 1.65 |
| 1976 | 41.7 | 1.24 |
| 1977 | 33.3 | 1.04 |
| 1978 | 34.4 | 1.82 |
| 1979 | 54.6 | 1.65 |
| 1980 | 38.4 | 1.77 |
| 1981 | 49.9 | 0.97 |
| 1982 | 49.1 | 1.64 |
| 1983 | 64.8 | 2.07 |
| 1984 | 46.9 | 2.14 |
| 1985 | 37.1 | 1.56 |
| 1986 | 50.2 | 1.71 |
a) Does there appear to be any trend in precipitation or streamflow during this period?
b) Is there a strong correlation between precipitation and streamflow? If not, can you explain why?
6. The Natural Resources Conservation Service (NRCS) measures snow accumulation in the mountains along established survey lines (snow courses) and at automated sampling stations (SNOTEL sites). Data from the SNOTEL sites are sent byradio telemetry to a central office, and posted at the following web site:
Information from SNOTEL sites may be retrieved by selecting SNOW ..... then SNOTEL Daily Site Reports (Map Based Interface) .....then the state of Colorado. At present, there's very little snowin thestate, so few of the sites are showing any data. You might want tobookmarkthis site for future reference. If you want to see what a SNOTELsite lookslike, click on one of the red dots.