 INTRODUCTION TO HYDROLOGY: LAB 3
 INTRODUCTION TO HYDROLOGY: LAB 3
| Section | Lab | Assigned | Due |
| 012,013 | Tuesday | Tuesday, Sep 18 |
Friday, Sep 21 |
| 011 | Thursday | Thursday, Sep 20 |
Monday, Sep 24 |
Figure 1a and 1b showing stream velocity distribution. Figure 1a is a cross -sectional view with contours indicating how velocity varies from top to bottom and across the stream channel. Figure 1b is an example of a velocity profile. Notice how how velocity changes with increasing depth, reaching the average velocity at approximately 0.6 of the total depth (or 0.4 of the depth from the bottom).
Figure 1a is an example of how the velocity of a stream can vary in the cross-stream direction and with depth. Stream velocity is typically faster at the surface and toward the middle of the channel, and slower along the sides and bottom of the channel due to differences in friction. The velocity profile in Figure 1b shows how the average velocity is usually at 0.6 times the total depth from the water surface, or 0.4 times the total depth from the bottom of the channel. This is why, in shallow channels (< 2.5 ft or < 0.75 m), current meter measurements are made at four tenths of total depth (from the bottom). In larger streams two velocity measurements are made at each vertical and averaged; one at two tenths of the total depth and one at eight tenths of the total depth. From these diagrams you can see why the float method could give velocities that are higher than the average stream velocity. You can also see how the volume-area method, which involves more detailed measurements of the velocity distribution, could give a more accurate representation of the discharge.
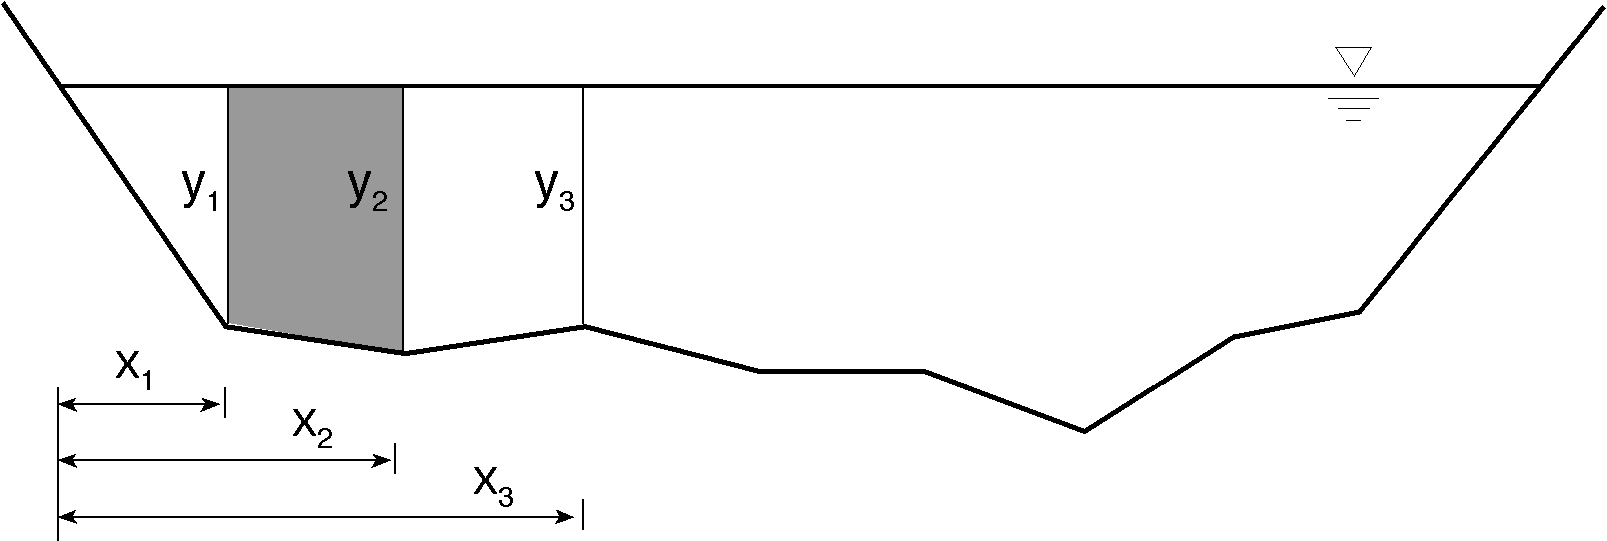
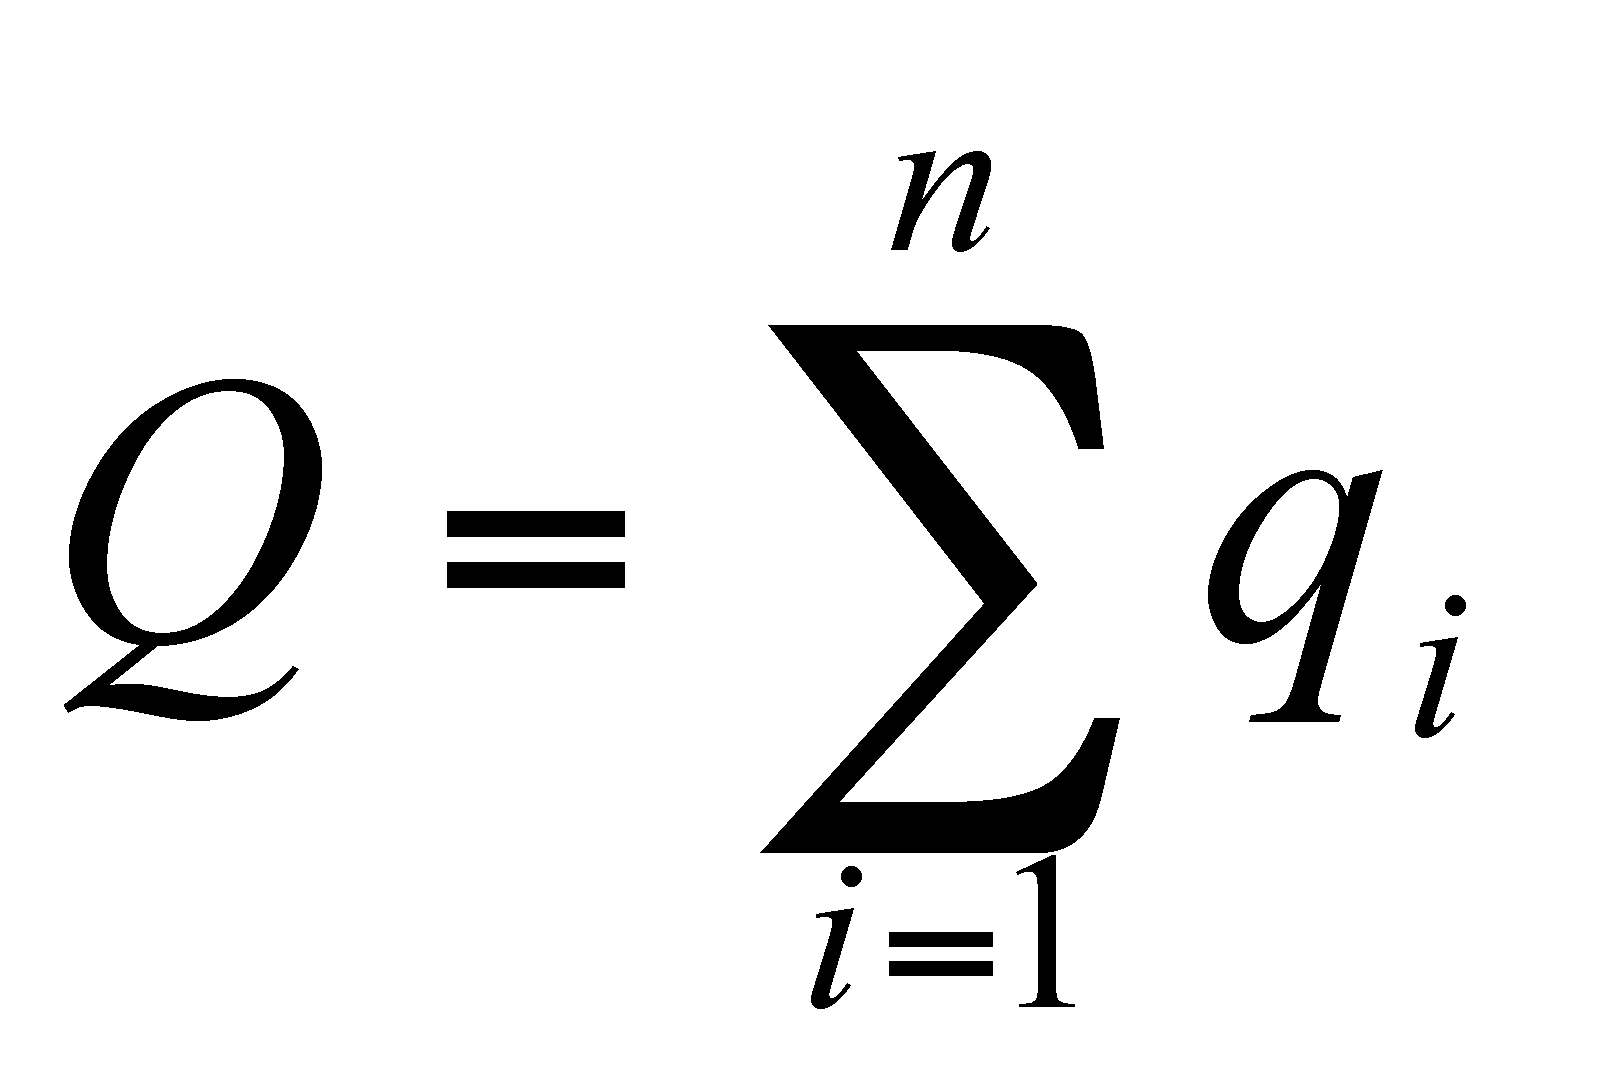
Today you will be using two methods to calculate the discharge of Boulder Creek; the float method and the velocity-area method. You will be measuring out a length of river for the simple float method. For the velocity-area method you will establish a cross section through Boulder Creek and measure velocity at points along this cross section at known intervals. Functionally, you will do this by dividing your stream into discrete sections where you can calculate the cross-sectional area and measure an average velocity (area x velocity = discharge) (Figure 2). Then you will sum the discharges, Q, of each section to determine the total Q of the stream at that cross-section. Obviously, the more sections you include, the more accurate your determination of discharge is, but there must be a balance between accuracy and efficiency.

Figure 2 An example of the velocity-area stream gauging cross-sectional set up, where x is the distance from the initial point to a vertical, and y is the depth of a vertical.

Equation1 To calculate the discharge of each section, where q is the discharge of each section, w is the width of the section, y is the depth of each vertical, and v is the velocity at each vertical.

Equation 2 To calculate the stream discharge (Q) of Boulder Creek
you need
to sum all the section discharge (q).
No eddies (or few eddies).
A smooth cross section with minimal flow obstruction.
Velocities and depths that do not exceed the range for which your equipment can accurately measure.
Converging flow, or a location where the channel is not getting wider immediately down stream of your gauging location.
For the float method, measure out some convenient distance along the stream bank (try at least 30 meters). In hydrology, this is called a "reach". Station one person at the upstream end of your selected reach and one at the downstream end. The person at the upstream end has the stop-watch and the oranges. The person at the top releases an orange and starts the clock when the orange floats over the top boundary of your reach. When the orange passes the bottom boundary of your reach, the person at the bottom signals to the top person to stop the clock. Someone records the time and notes the distance traveled. Do this at least three times.
Calculations:
Surface Velocity = Distance / Time
Average Surface Velocity = Sum Surface
Velocitites / Number of Trials
You will be using currant meters like the Price AA or its little brother, the Pygmy to measure velocity. We will go over the care and feeding of these meters in lab. The measurements you make of velocity will be used to estimate the average velocity for the area, or vertical where the velocity measurement was made. Find a place along Boulder Creek that fits the above requirements. String a measuring tape across the channel perpendicular to the flow and secure both ends. For this exercise you should have at least 10 verticals (mark 10 spots on the line with red tape). It is most convenient if the spacing between the verticals is even, but it is OK if they are not. Measure the velocity at each vertical. You will be counting the number of clicks that occur in at least 40 seconds. For the Pygmy meter and one of the settings on the Price AA, one click indicates one revolution of the cups. For depths of 0.75 meters (2.5 feet) or less, we assume that the average velocity can be estimated by measuring the velocity at 0.4 of the depth off the bottom (i.e. for a depth of 1 meter you would measure the velocity at a depth of 0.4 meters). The velocity meters are mounted on wading rods that have increments of measurement on them. You can use the rod to measure the depth at your vertical and then slide one portion of the rod such that the meter is at the desired depth of 0.4 times the depth. After a little practice, using these rods becomes much easier than it may seem at first!
NOTE: THESE METERS ARE DELICATE AND EXPENSIVE! PLEASE USE CARE! For example: DO NOT SMASH THEM AGAINST THE ROCKS!
Keep good notes and record the distance from the bank (location of each vertical), number of clicks, time, and depth for each vertical on your data sheet. When you have made velocity measurements for all the verticals along your cross section calculate the discharge of Boulder Creek. To do this use the preceding equations, Figure 2, and the data you recorded in your data table.