Protection of Headwater Catchments from Future Degradation:
San Miguel River Basin, Colorado
Barbara J. Inyan
INSTAAR and Department of Geography, University of Colorado, Boulder
Mark W. Williams
INSTAAR and Department of Geography, University of Colorado, Boulder
April 29, 1999
An enhanced, peer-reviewed version of this paper will be published in Mountain Research and Development in February 2001
Correspondence to: Mark W. Williams, INSTAAR and Department of Geography, Campus Box 450, Boulder, CO 80309-0450, USA. Telephone: 303/492-8830 Internet: markw@snobear.colorado.edu.
Abstract
Introduction
Study Area and Site Description
Methods
Landscape Mapping
Water Chemistry
Results
Landscape Mapping in Waterfall Canyon
Water Chemistry
Discussion
Sensitivity Analysis
Geographically-Referenced Sensitivity Maps
Developing Planning Decisions to Protect Headwater Catchments
Science and Public Policy
Conclusions
Acknowledgements
Literature Cited
Table 1 - Definitions and Map Representations of Landscape Types
Table 2 - Total Range of ANC and NO3- Concentrations for Major Landscape Types
Figures
During the summer of 1997, we conducted a study of high-elevation catchments in the San Miguel River Basin of southwest Colorado to assess sensitivity to water quality degradation, and develop a scientifically-based tool for water resources management. We mapped landscape types and associated water quality parameters with those types, enabling sensitivity assessment at the landscape unit scale, and so addressing catchment heterogeneity. Landscape type maps and derived sensitivity maps were entered into a geographic information system (GIS). They proved effective visual tools for use in policy decisions and public presentations.
Water quality issues addressed were sensitivity to acidification and nutrient enrichment. Landscape types with associated surface waters having growing season acid neutralizing capacity (ANC) < 50 meq L-1 were considered sensitive to acidification, and included talus and mining-related areas. Types sensitive to nutrient enrichment were those having average growing season NO3- concentrations > 9.0 meq L-1, and included tundra, talus, and rock glaciers.
Using the results of our study, San Miguel County commissioners adopted regulations for restricting development in sensitive high-elevation areas, including limits on building footprints and bans on septic systems. The adoption of these regulations lays the foundation for future application of this approach to headwater catchments in other western U.S. locations.
Keywords and key phrases: water quality, land-use regulations, headwater catchments, New West, trace metal contamination, nitrate, GIS
Mountain areas throughout the western U.S. have experienced a surge in popularity in the last decade, with unprecedented recreational tourism and the growth of mountain towns becoming an important factor in the changing landscapes and demography that characterize the New West (Riebsame et al., 1996; Riebsame, 1997). The resulting impacts caused by this growth in the West are of particular concern for high-elevation ecosystems and water resources. These areas are more sensitive to ecological stressors than downstream systems due to high levels of precipitation, large areas of exposed bedrock, rapid hydrological flushing during runoff, and limited soils and vegetation (Williams et al.,1993). Researchers in high-elevation areas have reported water quality problems such as decreasing alkalinity or ANC (Caine, 1995), episodic acidification (Williams et al., 1996a), and increased nitrate concentrations (Williams et al. 1996b; Baron and Campbell, 1997). Conflicting beliefs in the New West regarding natural resource use, especially water, pose a challenge for managers of these water resources. Traditional economic interests and recreational users are often opposed by environmentalists (Wilkinson, 1997). Thus, resource managers and planners in these high-elevation areas face increasingly critical and controversial watershed protection decisions.
At the same time, public policies and statutes place limitations on management strategies and outcomes. In the U.S., federal agencies must comply with federal laws which have provisions that address issues of water quality. The Federal Lands Policy and Management Act of 1976 (FLPMA) directs that public lands be managed in a manner that protects the quality of ecological, environmental, and water resource values (Coggins and Wilkinson, 1990). The Clean Air Act Amendments (CAAA) of 1990 require the U.S. Environmental Protection Agency (EPA) to monitor and report on the states of ecosystems, including surface waters and surface water quality, reflecting recognition of the importance of water quality to ecosystem health (EPA, 1995). At the state level, the Clean Water Act recognizes the rights of the states to control pollution, but all state water quality programs must meet EPA regulations for high water quality (Getches, 1997). Additionally, county level managers must adhere to local policies and regulations to protect sources of domestic drinking water.
There has been a scarcity of scientifically-based management tools for use in setting water resources policy in the West. Federal and state agencies have been mandated to adopt management prescriptions known as best management practices (BMPs) to regulate environmentally threatening land uses and achieve water quality standards (Whitman, 1989). Although BMPs are based on research by agency scientists, it is unclear how to proceed from scientific understanding to BMPs. Moreover, BMPs have been criticized for not always being effective, and even when they would help protect water quality, are not always implemented due to their high cost and lack of experience in implementation (Whitman, 1989). Ecological risk assessment, which originated in human health risk assessment, has recently come to the fore in assessing environmental problems, but has been criticized for inappropriate application of the paradigm to ecological impacts (Lipton et al., 1993), incorrect scientific assumptions, and confusion between science and policy (Power and McCarty, 1997). The Rapid Biotic and Ecosystem Response (RBER) strategy, proposed by the Pacific Rivers Council, is an integrative approach that uses independent scientific assessments and recommendations in combination with educating the public, empowering local communities, and providing management options (Doppelt et al., 1993). RBER fails, however, to specify how the scientific assessments are accomplished or how the results translate into policy. In addition, none of these approaches considers the unique characteristics of high-elevation environments.
The San Miguel River watershed (Figure 1) faces many of the problems occurring throughout the New West. Although it is known for its spectacular scenery and seemingly undisturbed wilderness character, past mining activity has left a legacy of acid mine drainage, with concentrations of trace metals such as zinc and copper exceeding standards for aquatic life, agricultural use, and drinking water in some locations (Lewis et al., 1992). Destruction of federally-protected wetlands during expansion of the Telluride Ski Area resulted in a fine of $1.1 million dollars in 1997 to Telluride Ski and Golf Company by the EPA. Population increases have resulted in over-appropriation of water and the reduction of in-stream flows in the Upper San Miguel River below quantities necessary to support fish habitat (San Miguel Watershed Coalition Planning Team, 1997). Furthermore, delineated areas within selected headwater catchments in the San Miguel River drainage are designated source water protection areas for public domestic water supply.
Our objective here was to work with local stakeholders, people with a vested interest in the water, in an attempt to prevent future degradation of headwater catchments in the San Miguel River drainage while providing for reasonable economic and recreational activities. We sought to design scientific research to address environmental concerns in the catchments, and to present our results in a manner that was understandable and usable by the planners. Our goal was to provide a scientifically-based management tool for use in setting water resources policy not only in San Miguel County, but also in other mountain areas of the West.
Our approach was to evaluate water quality parameters in the catchments, map landscape types, and then associate water quality results with those types. We chose water quality as a measure of ecosystem health since it provides unambiguous criteria that can support legal challenges (Coggins and Wilkinson, 1990). To accomplish this goal we sampled water quality in headwater basins in San Miguel County and evaluated the sensitivity of these ecosystems to perturbations such as acidification of surface waters and nutrient enrichment ("eutrophication"). To illustrate, based on previous research results, surface waters with alkalinity less than 50 meqL-1 are considered sensitive to acidification (Herlihy et al., 1996) and surface waters with concentrations of NO3- near or greater than 10 meqL-1 during the growing season are nutrient enriched (Williams et al., 1996b).
However, a confounding factor in interpreting ecosystem health from water quality measurements in headwater catchments is the spatial heterogeneity of high-elevation catchments in the Rocky Mountains (Baker and Weisberg, 1995). The often rapid and abrupt transitions from talus to tundra to exposed bedrock may cause large changes in water quality (Williams et al., 1996c). Recognizing the spatial heterogeneity in landscape types that is so characteristic of high-elevation areas in the Rocky Mountains, we delineated the types using spatial mapping approaches similar to those employed by other researchers in mountain areas (Ostendorf and Reynolds,1993; Walker and Walker, 1991; Baker and Weisberg, 1995; and Theobald et al., 1996).
Mapping landscape types or elements, however, has been primarily to address biological and biogeographical questions such as the relationship between landforms and vegetation patterns (Ostendorf and Reynolds, 1993), the influence of disturbance on variation in landscape structure (Walker and Walker, 1991; Baker and Weisberg, 1995), and snow-vegetation interaction (Walker et al., 1993). The interest in water in mountain landscape studies has been primarily for its effect on vegetation (Walker et al., 1989, Ostendorf and Reynolds, 1993, Walker et al., 1993).
In contrast, researchers in the Lake Tahoe Basin, California-Nevada are among the few who have mapped landscape types in high-elevation watersheds, and used the data in strategies to prevent water quality degradation (Bailey, 1974; Byron and Goldman, 1989). Although the research was undertaken because of existing water quality problems in Lake Tahoe due to anthropogenic disturbance, the focus was the prevention of further impacts (Wilkinson, 1993). The research approach was to map landscape types in the basin according to their ecological sensitivity, and then classify the level of land use, or the amount of anthropogenic disturbance allowed, appropriate to that sensitivity (Bailey, 1974).
Similar to work in the Lake Tahoe Basin, we used sensitivity evaluation as a basis for land use regulations. We, however, used water quality associated with the landscape types for our sensitivity assessment rather than attributes of the land itself, such as soil type and geomorphic setting, as in the work at Lake Tahoe (Bailey, 1974). In addition, our landscape mapping was independent of ecological sensitivities, which were determined after water quality assessment was performed. Maps of landscape types and ecological sensitivities were stored in geographical information system (GIS) data bases. Specific objectives were:
[1] Provide a spatial framework to study and evaluate ecosystem processes by mapping important landscape units;
[2] Develop water quality indicators of current ecosystem health and sensitivity to anthropogenic change;
[3] Provide geographically-referenced data for resource managers and concerned citizens to make informed decisions; and
[4] Use this information as the basis for developing planning decisions designed to protect headwater catchments from future degradation.
By focusing on landscape types, we avoided a one-size-fits-all approach for developing planning decisions that may not withstand legal challenge.
Study Area and Site Description
The predominantly free-flowing San Miguel River extends for 80 miles from high alpine meadows and waterfalls above the town of Telluride to a deep canyon confluence with the Dolores River (Figure 1). The San Miguel watershed is considered one of the few remaining "ecologically and hydrologically" intact river systems in the West, with all major tributaries of the Upper Colorado, except the Yampa and San Miguel Rivers, affected by water use regulation and depletion of flows. Pleistocene glaciation in the headwaters left steep rugged mountains and carved deep, U-shaped valleys bordered with sheer cliff walls. Extensive volcanic activity resulted in many intrusions and associated veins of ores including gold, silver, lead, and zinc (Vhay, 1962). Extraction of these economic minerals has resulted in water quality problems from acid mine drainage (Lewis et al., 1992). In the upper valleys, riparian vegetation is surrounded by tundra, steep talus fields, and rock cliffs interspersed with tundra on narrow ledges, above which is sheer bedrock. At elevations above about 3050 meters the geology is composed of several phases of volcanic rock, mainly breccia and tuffs, with many rock glaciers, landslide deposits and glacial drift areas. There are also several sites of intrusions of igneous rock. The subalpine valleys are forested with stands of aspen mixed with conifers. At subalpine elevations shale and sandstone predominate with some siltstone (Vhay, 1962; Burbank and Luedke, 1966).
As is typical of many areas in the intermountain West, the San Miguel River watershed is experiencing a new influx of people from urban areas and an increase in recreational tourism. The main town is Telluride (elevation 2575 meters; Figure 2), where the ski area has become a center for resort growth and second home construction (San Miguel Watershed Coalition Planning Team, 1997). High-elevation catchments in the county are currently largely undeveloped, but contain many patented mining claims which have become valuable as future home construction sites.
Research was conducted in 18 headwater basins of the San Miguel River watershed, located in the San Juan Range of the Rocky Mountains of southwest Colorado (Figure 1). The basins studied are situated at elevations ranging from about 2710 to 3950 meters (Figure 2). Intensive work was carried out in five of the basins, which were selected by local stakeholders based on regional development and source water issues. We chose Waterfall Canyon as the main catchment for study due to its importance as a source water area for domestic water supply for the town of Ophir (Figure 2). Ecological concerns in the currently undeveloped canyon center on impacts from a draining mine adit and potential home building on patented mining claims.
The water quality issues we targeted were i) sensitivity to acidification, ii) sensitivity to nutrient enrichment, and iii) potential trace metal contamination from acid mine drainage. In San Miguel County, as in much of the West, extensive past mining activity has resulted in acid mine drainage and the acidification of surface waters (EPA, 1995). Additionally, high-elevation catchments receive more atmospheric deposition of acidity producing pollutants than those at lower elevations due to higher amounts of precipitation (Williams et al. 1996a). Similar to other researchers, we used ANC as the measure of landscape sensitivity to acidification (Williams et al. 1995; Herlihy et al., 1996).
Alpine and subalpine surface waters in San Miguel County are particularly sensitive to nutrient enrichment for a number of reasons. Phosphate (PO43-) is the limiting nutrient in many aquatic systems. An analysis of Western Lakes Survey (WLS) data collected by the EPA in 1985 shows that the area in and near the county has the highest amounts of PO43- in the western U.S. (Eilers et al. 1987), most likely from the volcanic rocks that predominate (Stoddard, 1994). Furthermore, previous research has shown anomalously high levels of NO3- in surface waters of high-elevation areas in the vicinity (Inyan et al., 1998). Since nutrient enrichment is most likely to occur where both nitrogen (N) and phosphorus (P) levels are high (Elser et al. 1990), we chose NO3- and PO43- in surface waters as measures of landscape sensitivity to nutrient enrichment.
Landscape Mapping
The spatial distribution and areal extent of 33 landscape types were mapped in all 18 basins. In each basin, mapping extended from subalpine areas located just below treeline upwards to the watershed divide. Landscape types were defined a priori as shown in Table 1. Landscape types were mapped by physical surveys and delineated as polygons, lines, or points, depending on landscape type, on enlarged 7.5 minute quadrangles from the U.S. Geological Survey (USGS). Binoculars and an altimeter were used to improve the accuracy of the observations and map locations. Field observations were supplemented with black and white aerial photographs, at a scale of 1:24000, obtained from the U.S. Forest Service. The photos were particularly useful in the headwaters of higher elevation basins, which were covered with snow into late July. We estimate landscape boundary accuracy to be approximately two contour lines or 80 feet.
Information from field maps was transferred to base maps that were further enlarged, and then entered into ARCINFO, a GIS. Locations of avalanche paths were supplemented by the USGS snow avalanche map of the area (Armstrong and Carrara, 1981), as well as information from local skiers. Wetland sites and extents were supplemented by National Wetlands Inventory maps and Science Applications International Corporation maps (SAIC, 1998). Watershed boundaries, source water boundaries, and additional mine adit information were obtained from San Miguel County.
The landscape information was transferred to ARCINFO in several layers to facilitate manipulation of data. Landscape types represented by polygons, lines, and points were each a separate layer. In addition, notes were appended to ARCINFO layers on serendipitous observations about wildlife, hydrology, perturbations, etc. Information from additional sources were added as separate layers in the GIS, including avalanche zones, wetlands, watershed boundaries, and source water protection areas.
Water Chemistry
Field Methods
Although all the landscape types found in the basins were included in the mapping, collection of water samples concentrated on waters draining the major landscape types: forest, riparian, tundra, talus, and wetlands. Samples were also collected from rock glaciers, mine adits and mine waste sites. Each of the 18 basins was visited at least once with at least two water samples collected, one from alpine and one from subalpine locations. Additionally, water samples were collected as a time series from five streams at the catchment scale. Here we report the results from Waterfall Canyon, where water samples were collected weekly from approximately June 1, 1997 through June 30, 1997, and then bi-weekly July 1, 1997 through August 31, 1997.
Sample collection for water quality analysis followed the protocol of Williams and Melack (1991) and Williams et al. (1996c). Water samples were collected for chemical analysis as one 250 mL and two 125 mL grab samples from each sampling location. Sampling locations were streams draining landscape units and catchments. All water samples were collected in polyethylene bottles that had previously been rinsed copiously with deionized water, soaked for 24 hours in deionized water, and then rinsed again with deionized water. Bottles were rinsed three times with sample water before collection.
The 250 mL sample was filtered through a pre-rinsed Gelman 47 mm glass fiber filter with effective pore size of approximately 1.0 mm for later analysis of major solutes. One 150 mL unfiltered sample was collected for later analysis of NH4+, total N, and total P concentrations. These samples were frozen locally within one to four hours of collection, and kept frozen during transport to the Kiowa Environmental Chemistry Laboratory operated by the National Science Foundation�s Niwot Long-Term Ecological Research (LTER) network site and the University of Colorado�s Mountain Research Station. Analysis for pH, ANC, and specific conductance was performed locally on unfiltered sample water from the other 150 mL bottle 24 to 48 hours after collection. The pH of each sample was analyzed on an Orion portable pH meter using a Fisher Acumet standard size glass combination electrode. Conductance was measured with a Fisher Scientific Model 09-326-2 portable conductivity meter. Acid neutralizing capacity (ANC) was determined with the Gran titration method.
Laboratory Analysis
Samples were analyzed for concentrations of major solutes following the protocol of Williams and Melack (1991) and Williams et al. (1996c) at the Kiowa Environmental Chemistry Laboratory. The water samples collected in San Miguel County were analyzed using the same protocol as all other samples analyzed for the National Science Foundation�s LTER project.
Strong mineral anions (Cl-, NO3-, and SO42-) were measured using ion exchange chromatography (Dionex Model DX 500) employing chemical ion suppression and conductivity detection. Cations (Ca2+, Mg2+, Na2+, and K+) were analyzed with a Varian AA6 atomic absorption spectrophotometer. An air-acetylene flame was used with the addition of lanthanum chloride to suppress chemical and ionization interferences during calcium and magnesium determinations. NH4+, total N, and total P were measured using a Lachat QuickChem 4000 flow injection ion analyzer. A subset of samples were reanalyzed at the wet chemistry laboratory for pH, specific conductance, and ANC to verify the accuracy of the field measurements.
Particular attention was given to developing an analytic methodology for detecting low concentrations of orthophosphate (PO43-) due to its importance in nutrient enrichment. Ammonium molybdate and antimony potassium tartrate were added to the samples under acidic conditions. These compounds reacted with the PO43- ion to form a complex, which was then reduced with ascorbic acid to form a blue complex which absorbs light at 880 nm. The absorbance, which was measured using the Lachat QuikChem 4000 flow injection analyzer, is proportional to the concentration of orthophosphate in the sample. In order to detect low concentrations, the length of the sample loop of the injection valve was increased, thus increasing the amount of sample for which absorbance was measured. Also, since more sample was being used, the measurement period for each sample was increased.
All instruments were calibrated before use, and accuracy was assured by analyzing synthetic standards at the beginning of each sample run and after every 20 samples. In addition, the chemical data were validated using anion/cation charge balances as well as comparisons of measured and calculated specific conductance (Williams et al. 1996a). Any sample that did not meet the charge balance criteria of Peden (1983) were considered contaminated and either reanalyzed or not used. The detection limit for NO3- was 0.077 meq L-1 and precision was 0.5% (n=58). For PO43- the detection limit was 0.087 m eq L-1 and precision was 2.76% (n=61). The precision for ANC was � 4 m eq L-1.
Landscape Mapping in Waterfall Canyon
Waterfall Canyon provides a good example of the landscape mapping we conducted in all 18 headwater catchments (Figure 3). Riparian and willow areas were generally located adjacent to streams in subalpine areas. The nine wetland areas were also located adjacent to stream channels. One draining mine adit was mapped. The upper and alpine portions of the basin were dominated by talus, tundra, and exposed bedrock. The highest-elevation portions of Waterfall Canyon generally consisted of exposed bedrock forming near vertical cliff bands. Below the cliff bands, there were alternating areas of tundra and talus, with tundra generally, but not always located in flatter terrain. At times it was difficult to differentiate between landscape types, and these were classified as mixed types, such as talus and tundra (TA/TU area in Figure 3).
For the 18 basins as a whole, we mapped 33 landscape types plus the location of sampling sites for water quality (Table 1). About 78% of the total basin area was composed of tundra (25%), forest (20%), bedrock (18%) and talus (15%). We also mapped 111 avalanche chutes, 67 wetlands, 48 mine waste piles, and 3 draining mine adits. The mine delineations were not comprehensive due to the existence of numerous abandoned mines. The mapping of landscape units provided an inventory of the landscape resource, and thus a spatial framework for evaluating surface water chemistry.
In the 18 basins selected for study, we collected a total of 182 samples of surface waters from 75 different sites (Table 2). Our emphasis, however, was on the major landscape types: forest, mine adit and waste rock, riparian, rock glacier, talus, tundra, and wetland (Table 2). Here our data analysis focuses primarily on ANC and NO3- concentrations, although we analyzed all samples for the complete suite of major solutes. Surface waters draining forest, riparian, and rock glaciers had the consistently highest ANC concentrations. The ANC values for forest ranged between 533 and 1031 m eq L-1, for riparian between 229 and 3630 m eq L-1, and for rock glaciers between 384 and 749 m eq L-1. ANC concentrations in surface waters from talus, tundra, and wetlands varied considerably. Values for talus were between 18.4 and 372 m eq L-1, for tundra between 10.5 and 1033 m eq L-1, and for wetlands between 54.2 and 1965 m eq L-1. Waters draining areas of past mining activity had the lowest ANC concentrations, ranging between -80.1 and 324 m eq L-1 (Table 2).
There were similar variations in NO3- concentrations. Surface waters draining forest and wetland areas had minimum NO3- concentrations below detection limits. The maximum values were 17.9 and 14.5 m eq L-1 respectively. Surface waters draining areas of past mining activity had NO3- concentrations ranging between 5.7 and 13.5 m eq L-1. Waters draining riparian areas had NO3- concentration between 3.6 and 29.2 m eq L-1, while waters draining tundra had NO3- concentration between 3.5 and 24.7 m eq L-1. The surface waters with the highest NO3- concentrations were those draining rock glaciers, 15.9 to 44.7 m eq L-1, and talus, 10.3 to 15.6 m eq L-1 (Table 2).
To take a conservative approach in evaluating the above results as indicators of current ecosystem health and sensitivity to anthropogenic change, we took a closer look at these parameters during the growing season. During snowmelt runoff, ANC values generally reach an annual minimum because of dilution by snowmelt runoff (Williams et al., 1991), and NO3- values reach an annual maximum due to the release of strong mineral acids from the snowpack in the form of an ionic pulse (Williams et al., 1991). We define the growing season to be mid-July through August. At this time, there is little overland flow and most water that contributes to stream flow is from subsurface discharge (Williams et al., 1993). The subsurface water has undergone geochemical weathering reactions and has higher ANC values. Similarly, microbial activity and plant uptake in the subsurface environment has the potential to assimilate inorganic N and reduce the export of NO3- to surface waters.
There were significant differences in ANC concentrations among landscape types during the growing season (Figure 4). A one-way analysis of variance test (ANOVA) for ANC concentrations shows a significant difference (p < 0.001; df = 4, 19) at the alpha = 0.05 level. Forested sites had the highest ANC concentrations, with values ranging from 582 to over 800 meq L-1 (Figure 4). Riparian sites also had high ANC values, ranging from 245 to 641 meq L-1. Most tundra sites had ANC concentrations between 228 and 392 meq L-1, but two sites had noticeably lower values at 39 and 14 meq L-1. Waters draining talus sites consistently had relatively low ANC concentrations, ranging from 18 to 59 meq L-1. Median concentration of ANC values from draining mine adits and waste rock were less than 0 meq L-1, with a minimum of -80 meq L-1. In general, most landscape types had robust ANC concentrations with the exception of talus areas. However, acid mine drainage has the ability to acidify surface waters from all landscape types.
There were also significant differences in NO3- concentrations among landscape types during the growing season. An ANOVA test for NO3- concentrations shows a significant difference (p = 0.005; df = 4, 19) at the alpha = 0.05 level (Figure 5). Forested sites had the lowest NO3- concentrations, with a mean value of 3.5 meq L-1 and a range of 3 to 5 meq L-1. Interestingly, all values were above detection limits, which was not true of non-growing season NO3- concentrations included in the overall analysis described above. Riparian areas had a similar mean value of about 5 meq L-1, but a wider range of 1 to 12 meq L-1. Somewhat surprising, NO3- concentrations in surface waters draining tundra areas were elevated, with a mean concentration of 9.7 meq L-1 and a range of 3 to 13 meq L-1. Nitrate concentrations in talus areas ranged from 10 to 15 meq L-1 with a mean of 13 meq L-1.
Inorganic phosphate (PO43-) was found in most samples (n=168) at low concentrations. Measurable concentrations ranged from 0.1 to 4.2 meq L-1 with little difference among landscape types. The presence of PO43- in most water samples suggests that the potential for nutrient enrichment exists in all the basins studied.
A time series of water quality results at the basin scale for Waterfall Canyon confirm the results from the landscape types (Figure 6). Concentrations of ANC were about 600 meq L-1 near the start of snowmelt runoff, decreased to an annual minimum of about 200 meq L-1 in late July, and then began to increase in August. A comparison of the ANC results from Waterfall Canyon to other high-elevation catchments in the western U.S. provides context. ANC concentrations in Waterfall Canyon are quite robust and in general much higher than those in Emerald Lake basin in the Sierra Nevada (1.2 km2) and Green Lake 4 basin in the Colorado Front Range (2.2 km2). The volcanic and sedimentary bedrock in the headwater basins of the San Miguel River generally result in much faster geochemical weathering rates and greater production of ANC compared to the intrusive igneous rock that comprises both the Emerald Lake and Green Lake 4 basins.
The NO3- concentrations at the basin scale in Waterfall Canyon were surprisingly high (Figure 7). Concentrations ranged from a high of almost 30 meq L-1 on 19 June to a annual minimum of 10 meq L-1 on 29 July. A comparison of the NO3- results from Waterfall Canyon to the Emerald Lake basin and Green Lake 4 basin again provide context. The Emerald Lake basin has been shown to be N limited (Williams et al. 1995), with NO3- concentrations ranging from 8 meq L-1 down to detection limits of less than 1 meq L-1. These NO3- values are expected concentrations in an undisturbed watershed. The Green Lakes 4 catchment is located in the Colorado Front Range just to the west of the Denver metropolitan area. Elevated levels of inorganic N in wetfall have been shown to cause N saturation and increased amount of NO3- in surface waters at Green Lake 4 and other catchments in the Front Range (Williams et al., 1996b, Baron and Campbell, 1997, Fenn et al., 1998). Nitrate concentrations in surface waters from Waterfall Canyon were always greater than at Emerald Lake and Green Lake 4.
There is evidence that sedimentary bedrock containing appreciable amounts of fixed N contribute a large amount of NO3- to surface waters in some watersheds in California (Holloway et al., 1998). Although there are large amounts of sedimentary rock in San Miguel County at subalpine elevations, the pattern of NO3- levels is distinctly different from that in the California studies. Holloway et al. (1998) found maximum NO3- in autumn-early winter from flushing of mineral N, and low concentrations during runoff. In contrast, in San Miguel County we found maximum NO3- levels during runoff and lower concentrations in autumn.
Sensitivity Analysis
We defined surface waters with mean growing season ANC less than 50 meq L-1 as being sensitive to acidification (Herlihy et al., 1996), and considered surface waters with ANC less than 0 meq L-1 to be acidified. The ANC concentrations at the basin scale in Waterfall Canyon and for most landscape types were well above the sensitivity threshold. Surface waters draining talus, however, met the criteria for sensitivity to acidification. Surface waters from mine adits and mine waste piles also had low ANC concentrations, but were separately classified as being at risk for toxic metal contamination. Acidity is particularly a problem in those areas since toxic metals go into solution in low pH water, and then may be transported downstream, or infiltrate into groundwater (EPA, 1997). Acidity also affects the early life stages of aquatic amphibians and fish, which are especially sensitive to low pH values, with harm occurring at a pH of about 5.5 (Barmuta et al., 1990) to 5.7 (Harte and Hoffman, 1989). It is interesting to note that in some talus and mine adit and waste locations the acidifying agents were strong enough to overcome ANC concentrations as high as 800 meq L-1.
Nutrient enrichment is a term we use here to refer to elevated nutrients in surface waters and associated algal blooms (Harper, 1992). Increases in inputs of nutrients, particularly N and P, have been shown by researchers to lead to an increase in algal growth (Elser et al., 1990, Goldman et al., 1993). Nutrient enrichment occurs primarily from anthropogenic inputs, which can alter the relative importance of various nutrients in regulating algal growth and biomass. To illustrate, in Lake Tahoe, California-Nevada there has been a long-term shift from apparent colimitation by N and P to strong P limitation due to increases in N inputs (Goldman et al., 1993), most of which is from atmospheric deposition (Jassby et al., 1994).
Nutrient enrichment is an ecological impact of concern due to the resulting obnoxious odors from decaying plant material, bad taste imparted to the water, and negative visual impact. Nutrient enrichment can also lead to fish kills from higher water temperatures and decreased oxygen content of surface waters. In particular, trout, a popular sports fish in San Miguel County, require high levels of oxygen in water (Ryan and Marshall, 1994). In addition, nutrient enrichment can affect terrestrial ecosystems, where increases in NO3- inputs can result in changes in species abundance and composition, especially in alpine locations where plant species are adapted to low N availability (Bowman et al., 1993; Bowman and Steltzer, 1998). Excess N availability can cause nutrient imbalances in root and foliar ratios in trees affecting photosynthesis, forest growth, and even tree mortality (Vitousek et al., 1997).
Determining sensitivity to nutrient enrichment required consideration of both PO43- and NO3- levels. Since productivity of freshwater is usually limited by the availability of phosphorus when NO3- concentrations are elevated (Stoddard, 1994), PO43- is most likely the limiting nutrient. Under these conditions, PO43- can generate 500 times its weight in living algae (Wetzel, 1983), and so small amounts of PO43- are likely sufficient for growth of algal blooms. High algal activity, however, requires sustained amounts of PO43- (Wetzel, 1983). The finding of measurable, although low, levels of PO43- in all landscape types throughout the growing season meets these requirements.
In these systems, however, the presence of PO43- alone may not be sufficient for nutrient enrichment to occur. Ecological and geochemical constraints on N2-fixation may inhibit the ability of algae to make use of atmospheric N2 (Elser et al., 1990), and so a source of N is required. Nitrate in surface waters becomes an alternative input for N even though its use is more energy intensive since it must be reduced to ammonia to be physiologically available to plants (Wetzel, 1983). Thus, higher concentrations of NO3- than PO43- may be required for algal growth. Because there was measurable PO43- in most surface water samples, we concentrated on NO3- in our analysis of sensitivity to nutrient enrichment.
Surface water NO3- levels in both forested and high-elevation ecosystems are expected to be elevated during spring runoff, but then decrease to below detectable limits during the growing season (Stoddard 1994; Williams et al. 1996b). To be conservative, we considered growing season NO3- concentrations above 5 meq L-1 to be of concern. Additionally, we compared surface water NO3- concentrations during the growing season with NO3- concentrations in wet deposition. The National Atmospheric Deposition Program (NADP) operates about 200 wet precipitation collectors throughout the continental United States (NADP/NTN, 1997). Molas Pass and Wolf Creek Pass are high-elevation NADP collection sites in southwestern Colorado where the average annual volume weighted mean NO3- concentrations for 1997 range from 9.5 to 12.5 meq L-1. When NO3- concentrations in surface water approximate that in wet deposition, the watershed approaches a state in which it is no longer a net NO3- sink (Stoddard, 1994).
These considerations led us to designate landscape types with average growing season NO3- concentrations above 9.0 meq L-1 as being sensitive to nutrient enrichment, with concentrations above 5.0 meq L-1 as being moderately sensitive. This value is also close to the annual volume-weighted mean concentration of NO3- of about 10-12 meq L-1 reported by researchers for Colorado Front Range sites where N saturation is occurring (Campbell et al., 1995; Williams et al., 1996b). Tundra, talus, and rock glaciers meet the criteria for sensitivity. Riparian areas are moderately sensitive.
Although there is growing recognition of excess N in many North American ecosystems (Vitousek et al., 1997; Fenn et al., 1998), the finding of elevated NO3- in high-elevation basins in San Miguel County was unexpected. Compared to many other high-elevation lakes around the world, most Rocky Mountain lakes are relatively pristine, having median NO3- concentrations less than 1 meq L-1 (Psenner et al., 1989). In addition, previous studies in western Colorado have found little or no NO3- in surface waters during the growing season (Eilers et al., 1987; Newell, 1993; Inyan et al., 1998). Nitrate concentrations reflecting cumulative basin processes in Waterfall Canyon were consistently higher than those at Green Lakes Valley in the Colorado Front Range (Figure 7) (Williams et al., 1996b; Baron and Campbell, 1997). Green Lakes Valley is a high-elevation catchment adjacent to the Denver metropolitan area. The source of the NO3- in San Miguel County has not been determined.
Geographically-Referenced Sensitivity Maps
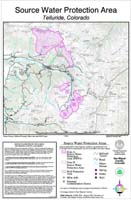
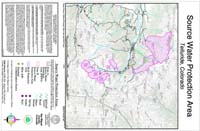
The association of specific landscape types with sensitivity to acidification or nutrient enrichment was the basis for developing three additional layers of GIS maps, derived directly from the polygon landscape types layer (Figure 8). Talus areas, considered to be sensitive to acidification, were mapped directly as acidification areas. An area of 200 feet extending down-slope of mine adits and mine waste piles was mapped as at risk for toxic metal contamination. The landscape types sensitive to nutrient enrichment, which include tundra, talus, rock glaciers, and riparian, were mapped as nutrient enrichment areas. Privately owned land parcels were then overlaid on these maps.
The maps proved to be a powerful tool for water resources planning and management decisions. They provided an easily-understood visual presentation of areas of potential water quality problems. In San Miguel County, planners successfully and effectively used the maps in their own planning process, as well as in presentations to county officials, federal agency personnel, and local business and community members. The maps allowed the general public to quickly and easily visualize the geographic extent of the areas sensitive to perturbation, and to assess which areas would be affected by potential land use regulations.
Developing Planning Decisions to Protect Headwater Catchments
It was necessary in determining planning decisions to consider the effect of human activities, and so we here assess possible impacts in ecologically sensitive areas with respect to the perturbations of concern in San Miguel County. Although in any sensitive area eliminating disturbances will avoid aggravating existing problems, the realities of contemporary society precluded that option.
In areas sensitive to nutrient enrichment, any activities adding nutrients to the basins would aggravate existing sensitivity. Septic tanks and associated leach fields are potential sources of both NO3- and PO43- from improperly functioning drainage fields, unsuitable septic tank location, or lack of maintenance. Leakage can affect both surface and groundwater (Butler and Payne, 1995). Landscape fertilizers and organic compounds used in ski slope treatment are direct inputs of NO3- and PO43-. Due to their compacted surfaces and impermeability, roads provide direct hydrologic pathways to creeks and streams (Jones and Grant, 1996), and so limit the opportunity for biological uptake of NO3- .
Road construction influences hydrological pathways by converting subsurface flows to surface flows (Jones and Grant, 1996), and thus potentially decreasing the opportunity for neutralization of any existing acidity. Excavation associated with building construction can also impact hydrological pathways. Disturbance of hydrological pathways is a special concern near mine adits and waste rock piles since the spread of both acidity and toxic metals could occur. Direct disturbance of mine adits and waste rock, or activities which compromise their physical stability, can result in the release of toxic and acidity producing materials (EPA, 1997).
Science and Public Policy
We worked directly with the San Miguel planning department and legal staff to draft amendments to the Land Use Code (LUC) to protect these headwater catchments from future degradation. The intent of these LUC amendments was to protect headwater catchments while allowing reasonable development. Decisions on specific practices and strategies to avoid aggravating existing sensitivities were issues of public policy, and as much political as scientific in nature. Legal, cultural, and community factors as well as science had be taken into account.
Nonetheless, it was important that the LUC amendments be directly related to our research results, and that we would be willing and capable of defending these LUCs in court. While the specific building footprints or road widths, for example, are not scientifically defensible from our research, the scientific basis for limiting those dimensions is defensible. The LUC amendments were based on the potential water quality impacts of the activities described above. They applied only to areas that were determined to be ecologically sensitive. To illustrate, following is a subset of the proposed LUC amendments for areas sensitive to nutrient enrichment ("eutrophication"):
5-2503 C. Areas at Risk for Eutrophication: Because of the potential for nutrient enrichment to result in oxygen depletion of surface waters and potentially modify flora and fauna characteristics, it is important to maintain hydrologic flowpaths and produce no new sources of nitrogen. Therefore:
I. residences shall have footprints 800 sq. ft. or less;
II. basements and caretaker units shall not be allowed;
III. development must comply with Section 5-21 Scenic Quality Standards;
IV. individual sewage disposal systems that rely on absorption to dispose of waste
shall not be allowed;
V. landscaping or fertilizer shall not be allowed unless required by an approved
state or federal permit for mining reclamation.
VI. blasting or dynamiting other than that associated with mining or avalanche-
control activities shall not be allowed;
VII. new roads and/or driveways shall only be allowed with Board of
Commissioners review, and only if:
a. roads and driveways are no wider than 10 ft.;
b. switchbacks and cuts and fills are minimized
to the fullest extent possible;
c. blasting is not utilized; and
d. winter plowing and maintenance is prohibited.
An explanation of the intent behind some of the amendments will clarify their impact on land use. The limitation on the size of building footprints allows a "reasonable" residence of 2400 square feet (three stories are allowed), but precludes large trophy homes and their increased environmental impact. New roads may be built, but the limitation to a 10 foot width means that emergency service vehicles do not have access. That restriction along with the prohibition on winter plowing and maintenance encourage shorter and fewer new roads.
These and additional proposed changes to the LUC were presented to the San Miguel County Planning Commission at a public workshop on 11 March 1998. There was extensive public notification, and the workshop was attended by both advocates and opponents of the proposed LUC amendments. Also in attendance for educational purposes was the Board of County Commissioners for San Miguel County, who must make the final decision as to whether or not to adopt the LUCs. Discussion was lively, extensive, controversial, but collegial. Somewhat to our surprise, after the workshop and public debate, the Planning Commission unanimously agreed to forward the proposed amendments to the Board of County Commissioners.
Additional public discussion and debate on the proposed LUCs was conducted before the Board of County Commissioners on 6 May 1998. Again, public discussion was lively and extensive. Because of the extensive time with public comments and also questions from the County Commissioners, vote on the proposed amendments was continued until the next meeting. On 3 June 1998, the Board of County Commissioners for San Miguel County formally accepted and legally adopted the proposed LUC amendments to protect 18 headwater basins of the San Miguel River basin from future degradation.
Conclusions
Using scientific measures of water quality, we were able to assess sensitivity to acidification and nutrient enrichment. The significant differences among landscape types in both ANC and NO3- enabled assigning these sensitivities at the landscape type level. The landscape type and ecological sensitivity GIS maps have proved to be powerful tools for managers and planners in developing resource management options. In addition, the GIS maps greatly facilitate community involvement, an important consideration in resource management decisions at the federal, state, and local levels.
The landscape types approach to ecological sensitivity analysis was shown to have several strengths as a scientifically-based method for use in high-elevation catchments:
[1] It is particularly applicable in high-elevation catchments due to their
spatial heterogeneity.
[2] It can show sensitivities before ecological damage is apparent through
observation, and so provides the opportunity for action to prevent future
degradation.
[3] Mapping landscape types is straightforward and inexpensive.
The adoption of LUC amendments in San Miguel County lays the foundation for its future application to other high-elevation catchments in the western U.S. The action of the San Miguel County Commissioners in adopting the amendments, and the fact that they are now law, sets a precedent that could be instrumental in preserving the scenic beauty of the West for the future. While we recognize that implementation of management practices to protect high-elevation watersheds is in the end a decision of political will, the adoption of the LUC amendments in San Miguel County shows that this will does exist when the changes are supported by scientific evidence. Especially in the West, with its constituency of conflicting interests, this analysis along with the extensive community involvement that occurred can open the way for protecting precious mountain resources.
Acknowledgments
C. Seibold provided laboratory analyses. A. Nisco provided extensive field assistance. Thanks to the CU-Geography cartography laboratory for Figure 1, and to the Southwestern Colorado Data Center for the GIS maps. Thanks are due to the volunteers from San Miguel County: T. Ferrier, K. Friedman, E. Jacobson, J. Kahn, B. Loughman, P. Miller, and S. Rose. Research was funded by San Miguel County Planning Department, the EPA, CU-Boulder CRCW program, NASA EOS, CU-Boulder UROP, and National Science Foundation grant DEB 9211776 to the Niwot LTER site.
Literature Cited
Armstrong, B.R, and P.E. Carrara, 1981: Map of Snow Avalanche Areas and Known Accident Sites in the Telluride Region, San Miguel County, Colorado. Map I-1316, Miscellaneous Investigations Series, U.S. Geological Survey.
Bailey, R.G., 1974: Land capability classification of the Lake Tahoe Basin, California-Nevada. prepared for the USDA, USFS, South Lake Tahoe, CA.
Baker, W. L. and P. J. Weisberg, 1995: Landscape analysis of the forest-tundra ecotone in Rocky Mountain National Park, Colorado. The Professional Geographer, 47( 4): 361-375.
Barmuta, L.A., S.D. Cooper, S.K. Hamilton, K.W. Kratz, and J.M. Melack, 1990: Responses of zooplankton and zoobenthos to experimental acidification in a high-elevation lake (Sierra Nevada, California, U.S.A.). Freshwater Biology, 23:. 571-586.
Baron, J.S. and D.H. Campbell, 1997: Nitrogen fluxes in a high-elevation Colorado Rocky Mountain basin. Hydrological Processes, 11( 7): 783-799.
Bowman, W.D., T.A. Theodose, J.C. Schardt, and R.T. Conant, 1993: Constraints of nutrient availability on primary production in two alpine tundra communities. Ecology, 74: 2085-2097.
Bowman, W.D. and H. Steltzer, 1998: Positive feedbacks to anthropogenic nitrogen deposition in Rocky Mountain alpine tundra. Ambio, 27( 7): 514-517.
Burbank, W.S. and R.G. Luedke, 1966: Geologic Map of the Telluride Quadrangle, Southwest Colorado. Department of the Interior, U.S. Geological Survey, prepared in cooperation with the Colorado Mining Industrial Development Board.
Butler, D. and J. Payne, 1995: Septic tanks: problems and practice. Building and Environment, 30(3): 419-425.
Byron, E.R., and C.R. Goldman, 1989: Land-Use and Water Quality in Tributary Streams of Lake Tahoe, California-Nevada. Journal of Environmental Quality, 18: 84-88.
Caine, N., 1995: Temporal trends in the quality of streamwater in an alpine environment: Green Lakes Valley, Colorado Front Range, U.S.A. Geografiska Annaler, 77A(4): 207-220.
Campbell, D., D.W. Clow, G.P. Ingersoll, M.A. Mast, N.E. Spahr, and J.T. Turk, 1995: Nitrogen deposition and release in alpine watersheds, Loch Vale, Colorado, USA. In ed. K.A. Tonnessen, M.W. Williams, and M. Tranter (eds), Biogeochemistry of Seasonally Snow Covered Basins., IAHS-AIHS Publ. 228, Intl. Assoc. Hydrol. Sci., Wallingford, UK, pp. 243-253.
Coggins, G.C. and C.F. Wilkinson, 1990: Federal Public Land and Resources Law, 1990 Statutory Supplement. The Foundation Press, Inc., New York.
Doppelt, B., M. Scurlock, C. Frissell, and J. Karr, 1993: Entering the Watershed: A New Approach to Save America�s River Ecosystems. Island Press, Washington, DC.
Eilers, J., P. Kanciruk, R.A. McCord, W.S. Overton, L. Hook, D.J. Blick, D.F.Brakke, P.E. Kellar, M.D. DeHaan, M.E. Silverstein, and D.H. Landers, 1987: Characteristics of lakes in the Western United States, Volume II, Data compendium for selected physical and chemical variables. EPA/600/3-86/054b, U.S. Environmental Protection Agency, Washington, D.C.
Elser, J.J., E.R. Marzoff, C.R. Goldman, 1990: Phosphorus and nitrogen limitation of phytoplankton growth in the freshwater of North America: a review and critique of experimental enrichment. Canadian Journal of Fisheries and Aquatic Sciences, 47: 1468-1477.
EPA, 1995: Historic Hardrock Mining: The West�s Toxic Legacy, The Critical Link between Water Quality and Abandoned Mine Sites. Region 8, EPA 908-F-95-002.
EPA, 1997: EPA�s National Hardrock Mining Framework. Office of Water, EPA 833-B-97-003.
Fenn, M.E., M.A. Roth, J.D. Aber, J.S. Baron, B.T. Bormann, D.W. Johnson, A.D. Lamly, S.G. McNulty, D.F. Ryan, and R. Stottlemyer, 1998: Nitrogen excess in North American ecosystems: predisposing factors, ecosystem responses, and management strategies. Ecological Applications, 8(3): 706-733.
Getches, D.H., 1997: Water Law in a Nutshell, third edition. West Publishing Company, St. Paul, Minn.
Goldman, C.R., A.D. Jassby, S.H. Hackley, 1993: Decadal, interannual, and seasonal variability in enrichment bioassays at Lake Tahoe, California-Nevada, USA. Canadian Journal of Fish and Aquatic Science, 50: 1489-1496.
Harper, D, 1992: Eutrophication of Freshwaters, Principles, problems and restoration, Chapman and Hall, London.
Harte, J. and E. Hoffman, 1989: Possible effects of acid deposition on a Rocky Mountain population of the tiger salamander, Ambystoma tigrinum. Conservation Biology, 3: 149-158.
Herlihy, A.T., P.R. Kaufmann, J.L. Stoddard, K.N. Eshleman, and A.J. Bulger, 1996: Effects of Acidic Deposition on Aquatic Resources in the Southern Appalachians with a Special Focus on Class I Wilderness Areas. Southern Appalachian Mountain Initiative, Asheville, NC.
Holloway, J.M., R.A. Dahlgren, B. Hansen, and W.H. Casey, 1998: Contribution of bedrock nitrogen to high nitrate concentrations in stream water. Nature, vol. 395, no. 22, pp. 785-788.
Inyan B.J., M.W. Williams, K. Tonnessen, D. H. Campbell, and J.T. Turk, 1998: Seasonal inorganic nitrate release in alpine lakes on the Colorado western slope. Physical Geography, 19(5): in press.
Jassby, A.D., J.E. Reuter, R.P. Axler, C.R. Goldman, and S.H. Hackley, 1994: Atmospheric deposition of nitrogen and phosphorus in the annual nutrient load of Lake Tahoe (California-Nevada). Water Resources Research, 30(7): 2207-2216.
Jones, J.A. and G.E. Grant, 1996: Peak flow responses to clear-cutting and roads in small and large basins, western Cascades, Oregon. Water Resources Research, 32(4):. 959-974.
Lewis, W. S., W. W. Huskie, A C. Woldow, J. Emerick, and C. Pfister, 1992: An evaluation of mining-related metals pollution in Colorado streams. Colorado Mined Land Reclamation Division, Department of Environmental Sciences, Colorado School of Mines, Golden, CO, pp 1-130.
Lipton, J., H. Galbraith, J. Burger, and D. Wartenburg, 1993: A paradigm for ecological risk assessment. Environmental Management, 17(1): 1-5.
NADP/NTN, 1997: National Atmospheric Deposition Program/National Trends Network. NADP/NTN Coordination office, Natural Resource Ecology Laboratory, Colorado State University, Fort Collins, Colorado.
Newell, A.D., 1993: Inter-regional comparison of patterns and trends in surface water acidification across the United States. Water, Air, and Soil Pollution, 67: 257-280.
Ostendorf, B. and J.F. Reynolds, 1993: Relationships between a terrain-based hydrologic model and patch-scale vegetation patterns in an arctic tundra landscape. Landscape Ecology, 8(4): 229-237.
Peden, M.E., 1983: Sampling, analytical, and quality assurance protocols for the National Atmospheric Deposition Program. In Campbell, S.A. (ed) Sampling and Analysis of Rain, American Society for Testing and Materials, Philadelphia, PA, pp. 72-83.
Power, M. and L.S. McCarty, 1997: Fallacies in ecological risk assessment practices. Environmental Science and Technology, 31(8): 370A-375A.
Psenner, R., 1989: Chemistry of high mountain lakes in siliceous catchments of the Central Eastern Alps. Aquatic Science, 51(2): 108-128.
Riebsame, W.E., H. Gosnell, and D.M. Theobold, 1996: Land Use and Landscape Change in the Colorado Mountains I: Theory, Scale, and Pattern. Mountain Research and Development, 16(4): 395-405.
Riebsame, W.E., general editor, 1997: Atlas of the new West: portrait of a changing region. W.M. Norton and Co., New York.
Ryan, P.A. and T.R. Marshall, 1994: A niche definition for lake trout (Salvelinus namaycush) and its use to identify populations at risk. Canadian Journal of Fish and Aquatic Science, 51(11): 2513-2519.
SAIC, 1998: Ecological Characterization of Wetlands in Eastern San Miguel County, Colorado. Report prepared by Science Applications International Corporation for San Miguel County Planning Department.
San Miguel Watershed Coalition Planning Team, 1997: San Miguel Watershed Plan: A Collaborative Management Framework for the San Miguel Basin. San Miguel Watershed Coalition, PO Box 283, Placerville, Colorado 81430, pp. 1-180.
Stoddard, J.L., 1994: Long-term changes in watershed retention of nitrogen: Its causes and aquatic consequences", In Baker, L.A. (ed), Environmental Chemistry of Lakes and Reservoirs, Adv. Chem. Ser. No. 237, Amer. Chem. Soc., Washington, D.C., pp. 223-284.
Theobald, D.H., H. Gosnell, W.E. Riebsame, 1996: Land use and landscape change in the Colorado mountains II: A case study of the East River Valley. Mountain Research and Development, 16(4): 407-418.
Vhay, J.S., 1962: Geology and Mineral Deposits of the Area South of Telluride Colorado. Geological Survey Bulletin 1112-G, United States Government Printing Office, Washington, D.C.
Vitousek, P.M., J.D. Aber, R.W.. Howarth, G.E. Likens, P.A. Matson, D.W. Schindler, W.H. Schlesinger, and D.G. Tilman, 1997: Human alteration of the global nitrogen cycle: sources and consequences. Ecological Applications, 7(3); 737-7750.
Walker, D.A., E. Binnian, B.M. Evans, N.D. Lederer, E. Norstrand, and P.J. Webber, 1989: Terrain, vegetation and landscape evolution of the R4D research site, Brooks Range Foothills, Alaska. Holarctic Ecology, 12: 238-261.
Walker, D.A., and M.D. Walker, 1991: History and pattern of disturbance in Alaskan arctic terrestrial ecosystems: A hierarchical approach to analysing landscape change. Journal of Applied Ecology, 28: 244-276.
Walker, D. A., J. C. Halfpenny, M. D. Walker, and C. A. Wessman, 1993: Long-term studies of snow-vegetation interactions. BioScience, 43(5): 287-301.
Wetzel, R.G., 1983: Limnology, 2nd edition, Saunders College Publishing, Harcourt Brace College Publishers, New York.
Whitman, R., 1989: Clean water or multiple use? Best management practices for water quality control in the national forests. Ecology Law Quarterly, 16: 909-966.
Wilkinson, C.F., 1993: A View Toward the Future. In MacDonnell, L.J. and Bates, S.F. (eds), Natural Resources Policy and Law: Trends and Directions, Natural Resources Law Center, University of Colorado School of Law, Island Press, Washington, D.C., pp. 216-231.
Wilkinson, C.F., 1997: Paradise Revisited. in Riebsame, W.E. (ed), Atlas of the new West: portrait of a changing region, W.M. Norton and Co., New York.
Williams, M.W. and J.M. Melack, 1991: Solute chemistry of snowmelt and runoff in an alpine basin, Sierra Nevada. Water Resources Research, 27(7): 1575-1588.
Williams, M.W., A.D. Brown, and J.M. Melack, 1993: Geochemical and hydrologic controls in the composition of surface water in a high-elevation catchment, Sierra Nevada, California. Limnology and Oceanography, 38(4): 775-797.
Williams, M.W. , R.C. Bales, J. Melack, and A. Brown, 1995: Fluxes and transformations of nitrogen in a high-elevation catchment, Sierra Nevada. Biogeochemistry, 28: 1-31.
Williams, M.W., M. Losleben, N. Caine, and D. Greenland, 1996a: Changes in climate and hydrochemical responses in a high-elevation catchment in the Rocky Mountains, USA. Limnology and Oceanography, 41(5): 939-946.
Williams, M.W., J.S. Baron, N. Caine, R. Sommerfeld, and R. Sanford, Jr., 1996b: Nitrogen Saturation in the Colorado Front Range. Environmental Science and Technology, 30(2): 640-646.
Williams, M.W., P.D. Brooks, A. Mosier, and K.A. Tonnessen, 1996c: Mineral nitrogen transformations in and under seasonal snow in high-elevation catchments of the Rocky Mountains, United States. Water Resources Research, 32(10): 3161-3171.
Table 1 - Definitions and Map Representations of Landscape Types
________________________________________________________________________
Name Designation Mapping Description
/Symbol Type
________________________________________________________________________
|
avalanche chute |
arrow |
line |
a swath on a steep tree-covered slope that has no trees or only a few small trees indicating that avalanches have run |
|
alluvial fan |
alluvial fan |
polygon |
cone or fan-shaped deposits occurring where mountain streams enter flatter land |
|
beaver pond |
beaver pond |
polygon |
small lake formed by a dam built by beavers |
|
boulders |
icon |
point |
pieces of bedrock varying in size, but at least 2 feet in diameter |
|
bedrock |
BR |
polygon |
exposed areas of country rock, no vegetation |
|
cabin |
icon |
point |
small wooden building |
|
dam |
icon |
point |
mound of dirt or other material impeding water flow |
|
debris flow |
debris flow |
line |
channel of unconsolidated rock, can have levees on either side, located on hillslopes |
|
dirt/clear cut |
dirt/clear cut |
polygon |
area of denuded forest not covered by vegetation |
|
ditch |
icon |
point |
channel for water flow, may be concrete lined or unlined |
|
down trees |
down trees |
polygon |
area covered with uprooted trees, usually from avalanches |
|
flood |
flood |
line |
indication of stream where flooding has occurred as shown by a channel much wider than early season stream width |
|
forest |
F |
polygon |
area of conifers and/or deciduous trees |
|
lake |
lake |
polygon |
impounded surface water greater than 4 hectares in area |
|
major road |
solid parallel lines |
line |
paved or graded dirt road |
|
meadow |
M |
polygon |
area of grasses and flowers with few, if any trees, below 11,000 feet, slope can vary |
|
minor road |
dashed parallel lines |
line |
unimproved dirt road |
|
moraine |
moraine |
line |
glacial depositional feature consisting of unsorted glacial till |
|
mine adit |
MA |
point |
entrance to a mine |
|
mine waste |
MT |
polygon |
the soil and rock resulting from accessing or processing an ore or mineral body |
|
riparian |
RI |
polygon |
areas along streams with lush vegetation, high soil moisture |
|
rock glacier |
RG |
polygon |
accumulation of rocky debris with a form similar to true glaciers, covered with lichen or fine vegetation, has an ice core or interstitial ice |
|
rock spire |
rock spire |
polygon |
high, narrow column of rock
|
|
sample collection site |
filled circle |
point |
stream, lake or wetland location where a water sample was collected |
|
seep |
seep |
line |
stream of water originating from a spring |
|
snow field |
S |
polygon |
area of semi-permanent snow |
|
spring |
spring |
polygon |
area where water comes to the surface from below ground level |
|
staff gauge |
icon |
point |
location in a stream of a ruler to measure stream depth |
|
stream |
stream |
line |
flowing water |
|
talus |
TA |
polygon |
accumulation of rocks at the base of a cliff, headwall, or slope; little or no vegetation |
|
tundra |
TU |
polygon |
area of alpine vegetation (low lying shrubs, herbs, grasses), no trees, above 11,000 feet, slope can vary |
|
waterfall |
asterisk |
point |
cascade of stream water down a steep landscape
|
|
wetland |
W |
polygon |
areas of water-saturated ground with hydrophytic vegetation, hydrophilic soil, most are on flat lands near water bodies, can also be in pocket areas, especially at high-elevation or on hillslopes which are continuously wet |
|
willows |
WI |
polygon |
areas with willow vegetation, high soil moisture, can be on hillslopes or level ground |
________________________________________________________________________
Table 2 - Total Range of ANC and NO3- Concentrations for Major Landscape Types
________________________________________________________________________
Landscape ANC (meq L-1) NO3- (meq L-1)
Type N low high low high
________________________________________________________________________
|
forest |
21 |
533 |
1031 |
0.0 |
17.9 |
|
mining activity* |
7 |
-80.1 |
324 |
5.7 |
13.5 |
|
riparian |
29 |
229 |
3630 |
3.6 |
29.2 |
|
rock glacier |
4 |
384 |
749 |
15.9 |
44.7 |
|
talus |
5 |
18.4 |
372 |
10.3 |
15.6 |
|
tundra |
22 |
10.5 |
1033 |
3.5 |
24.7 |
|
wetland |
48 |
54.2 |
1965 |
0.0 |
14.5 |
________________________________________________________________________
* mine adit, waste rock
Figure 1 - The San Miguel River Basin drainage area.
Figure 2 - Locations of the 18 headwater catchments we studied in the San Miguel River basin. More intensive sampling was conducted in five basins: Waterfall Canyon, Mill Creek, Prospect Creek, Alta Lakes, and Bridal Veil Basin.
Figure 3 - GIS map of Waterfall Canyon outlines the landscape types within the basin, and shows major hydrological features including streams, springs, and waterfalls. Potential hazard areas, such as avalanche paths and mine adits, are also delineated. Abbreviations are defined in Table 1.
Figure 4 - A box and whisker plot of ANC concentrations during the growing season (July 15 - August 31). A one-way analysis of variance test shows that ANC concentrations vary significantly with landscape type (p = 0.001; df = 4,19).

Figure 5 - A box and whisker plot of NO3- concentrations during the growing season (July 15 - August 31). A one-way analysis of variance test shows that NO3- concentrations vary significantly with landscape type (p = 0.005; df = 4,19).

Figure 6 - ANC concentrations in the alpine portion of Waterfall Canyon range between 229 and 611 meq L-1 indicating that the basin is well buffered. Concentrations are highest early in runoff, and then decrease until August when they increase. ANC concentrations are consistently higher than in Emerald Lake (Williams and Melack, 1991) and Green Lakes 4 (Caine, 1995).
Figure 7 - NO3- concentrations in Emerald Lake reflect the expected pattern of being highest during runoff, and then decreasing to near detection limits during the growing season (Williams and Melack, 1991). NO3- concentrations in Waterfall Canyon remain above 9 meq L-1 throughout the growing season, and are consistently higher than those in Green Lakes Valley, an area known to be highly disturbed (Williams et al., 1996b).
Figure 8 - This GIS map shows areas in Waterfall Canyon sensitive to acidification and nutrient enrichment (eutrophication). The map also shows source water area boundaries, avalanche chutes, wetlands, and areas possibly at risk for toxic metal contamination.
Landscape Types Maps | Ecological Sensitivities Maps | Source Water Maps | INSTAAR Report
SWDC | EPA | Colorado Department of Health and Environment | INSTAAR
Main Page | Home | Top
webmaster