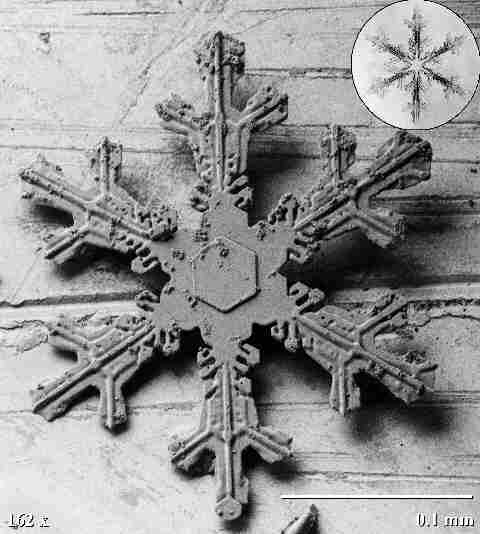
 SNOW
HYDROLOGY (GEOG 4321/5321): HOMEWORK ASSIGNMENT 2
SNOW
HYDROLOGY (GEOG 4321/5321): HOMEWORK ASSIGNMENT 2
Instuctor: Mark Williams
Telephone: 492-8830
TA: Qinghuan Zhang
Email: qinghuan.zhang@colorado.edu
Homework 2
Assigned Jan 27th.
This assignment will be due Monday, Feb 1st, to be turned into Qinghuan's mailbox in Guggenheim by 5pm.
Late assignments will be penalized 10% per day. No work will be
accepted after 2pm on Wednesday
40 possible points.
Please box all your quantitative answers.
Please show all your work! Answers without work will only receive
partial credit.
- Suppose you skied up to Niwot Ridge and drank all the liquid in
your 1 liter water bottle, then tightly replaced the cap. Calculate the
new volume of your water bottle upon returning to Boulder, using the
Ideal Gas Law. Assume
that at Niwot Ridge the air temperature was -10degC and atmospheric
pressure
was 0.5 atm; in Boulder the air temperature was +27degC and atmospheric
pressure
was 0.9 atm (5 points).
- The Green Lakes Valley is located within the city of Boulder
Watershed, consequently, it is an important source of water for the
City of Boulder. Calculate mean SWE, density, and temperature for Green
Lakes Valley, April 1996. To do so, use data from 10 snowpits located
throughout the valley. Go
to the NWT LTER web page at http://culter.colorado.edu/NWT/index.html.
Enter
the new site, under Data select Available Data, then
Hydrology, then Niwot Ridge/Green Lakes Valley
snow
cover profiles: Snow water equivalent data.
- The ten snowpits located in Green Lakes Valley are: AVN,
AVV, G3N,
G3S, G3V, G4S, G4V, G5N, G5S, and G5V. Each of the ten pits was sampled
on
either 23 or 24 April, 1996. Calculate the mean, standard deviation,
and standard
error for snow depth,density, temperature and SWE at the ten pits.
- Snowpit 006 is an "index" snowpit that we sample weekly with
the hope that it represents the Niwot Ridge saddle and Green Lakes
Valley. Compare the mean results from the ten Green Lakes Valley sites
for snow depth, SWE, temperature and density to that of pit 006 on 25
April 1996. Are these values from pit 006 representative of the average
Green Lakes Valley snowpack parameters you calculated from the ten
snowpits above? Give your answer in five sentences or less (10
points total).
- How well do SnoTel sites work for measuring SWE? Here we will
compare manual SWE measurements made at snow courses to measurements
made at automated SnoTel sites. Assume that SWE measured at snow
courses is the "true" SWE measurement.
At Wolf Creek pass ,
compare annual SWE measurements made in April from snow course data
(independent variable) to SnoTel data (dependent variable) (10
points total) .
- Regress SnoTel annual SWE values against snow course data.
- Show graph with regression line.
- what is the r-squared?
- what is the slope of the regression line?
- what is the y-intercept of the regression line?
- is this a significant relationship between the SnoTel
and snow
course data?
- Compare SnoTel and snow course annual SWE values using a
paired-difference t-test.
- What is the mean of the difference between the two
methods?
- What is the standard deviation of the difference between
the two methods?
- What is the p-value?
- Is the SnoTel measurement of SWE significantly different
than the snow course measurement of SWE at the 0.05 probability level?
- 4. A Proposal has been made to replace all snow courses in the
western US with SnoTel sites. Use the results from the statistical
analyses in question 3 as well as your knowledge of the advantages and
disadvantages of SnoTel and snow course measurement systems to answer
the following questions (10 points):
- In terms of the accuracy of the data being collected what
would the consequences of this move be? In other words are SnoTel sites
a good substitute
for snow courses in terms of both the magnitude of SWE measured at the
site
each year and the interannual trends in the SWE record?
- What are some of the functional disadvantages of SnoTel
sites as
compared to snow courses?
- What is the temperature range and supersaturation range where
dendritic snow crystals are found (5 points) ? Answer is in
the Avalanche Handbook; in the Earth Sciences Reserve Book room.
- Using the snow pit data you all collected, calculate the total
SWE for each pit, and calculate the mean, standard deviation, and
standard error of the mean as you did in question 2.