SNOTEL is a system that is currently replacing the original Snow Course system because: more frequent data were required, more types of data were required - but the original problem is STILL AT THE CORE OF THE PROGRAM - WATER MANAGEMENT. Thus this new system has all the same site location characteristics as the original system and therefore, all the same data application limitations! While yielding more data, it may not be as appropriate for some analyses. (bottom line, people will use whatever data are available - whether they are strategically placed the most appropriate location or not: something is better than nothing principle)
In the 70's!
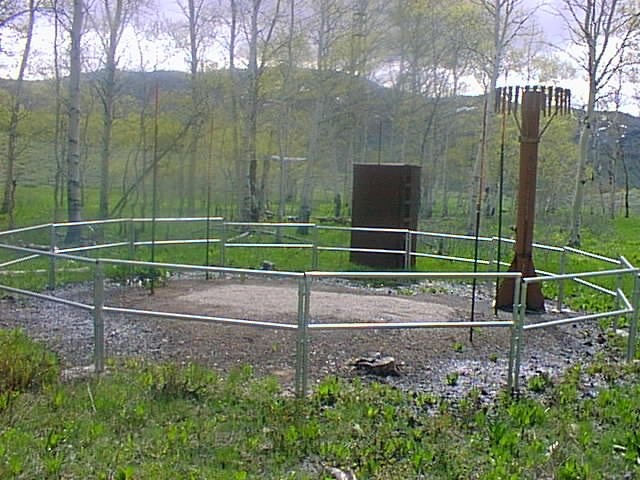
Enter the SNOW PILLOW! The pillow, made of rubber, steel, hypalon, etc, is filled with an antifreeze solution (50/50 mix of water and ethanol with flouresceine dye to make it a flourescent green). As the snowpack accumulates on the pillow, it increases the fluid pressure (obviously as this is a quasi closed system) within the pillow. By running a fluid line to a shelter and then up the wall, where, there is, conveniently, an engineering tape - you have a manometer! Viola! Inches of water contained in the snowpack is easily read, like it was off the bathroom wall, where most valuable information is posted!
3 Steel Pillows
10' Hypalon pillow
What we now have, is a replicable, non-destructive sampling device that gives us snow water equivalent. What we have lost is: depth - this system only yields snow water equivalent, and therefore we do not have any depth, and hence density observations.
At this point, we still have to visit the site each time we want to record a data point - we have solved only the destructive sample problem. Enter now, the pressure transducer, a data sampling and storage device and a transciever/reciever system. The pressure transducer is simply an electronic device that when tickled, gives a voltage reading dependent on the pressure put against a plate or bellows of some type. The higher the pressure, the higher the voltage reading. This device is then calibrated and a mathematical conversion equation utilized to convert voltage into snow water equivalent in inches! The data logger or equivalent computerized device simply determines when to take a reading, processes the information, makes necessary conversions, tacks a time stamp to the data and stores it till it can be transferred to the central data collection platform. The transceiver/receiver is simply the radio function.
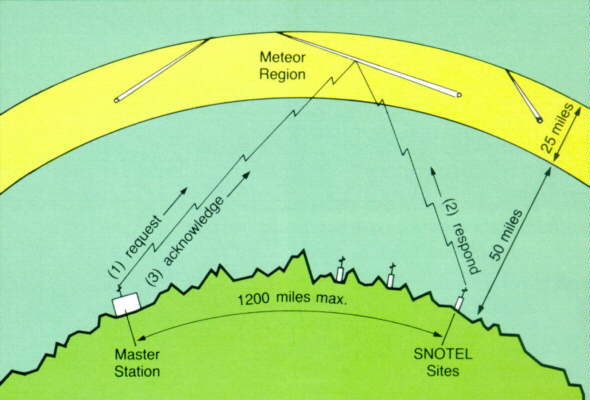
In SNOTEL, it is impractical to use line of sight radio systems due to the steep mountainous terrain where sites are located. Satellite transmission is equally impractical due the problems associated with satellite angle and mountain interference. Using a ultra low frequency, the master station broadcasts continuous radio signals into the atmosphere which in turn bounce off of ionized meteoric dust randomly onto the earth's surface. If a station happens to be hit, it responds within milliseconds, sending a return signal with all appropriate data back to the master station. Utilizing this mechanism, stations can be located in very radio wave impenetrable locations.
Precipitation gages work is much the same manner. These gages are storage type gages: that is to say, everything that falls into the gage is kept and the amount of precipitation is calculated from one time increment to another. For example the storm that happens today yields today's reading of 31.3 and yesterday had a reading of 30.2 giving a storm total of 1.1 inches.
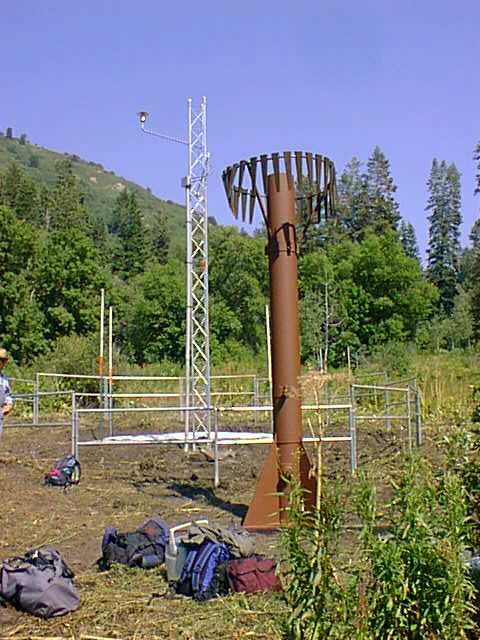
Storage Rain Gage
On this gage, notice the baffles at the top. This is known as an Alter Wind Screen. This device breaks up the wind currents and allows snow to fall vertically into the gage as opposed to flowing horizontally across the orifice. As wind blows across a non-screened gage, a small pillow of air mounds across the orifice and light density snow can bounce off this higher pressure pillow to the outside. Horizontally falling snow has a substantially smaller target than does vertically falling snow as well. Non-screened gages display significantly lower precipitation catches than do screened gages. If, in the station history of a site, a gage that historically has not had a screen is fitted with one, it, essentially is a NEW SITE. The historical record will be significantly different than the current one. Comparing same site pillow data to non-screened precipitation data will yield conflicting results as well.
The precipitation gage is plumbed as the pillow was, to a manometer inside a shelter, fitted with a pressure transducer and various electronics for data storage, calculation and transmission.
This was the original SNOTEL system: pillows and precipitation gages. A lot of chewing gum and duct tape made the system work in the early years: custom interface boards, electronics sensitive to moisture and cold made for a very temperamental system. There were many sensor failures and a high learning curve. Later, in the 80's, temperature sensors were added as a standard parameter. These are thermistor type sensors with a large range: about -40 to 160 degrees.
In recent years, other sensors are starting to be added as well: sonic depth sensors, wind speed and direction, soil moisture, soil temperature, relative humidity to name a few.
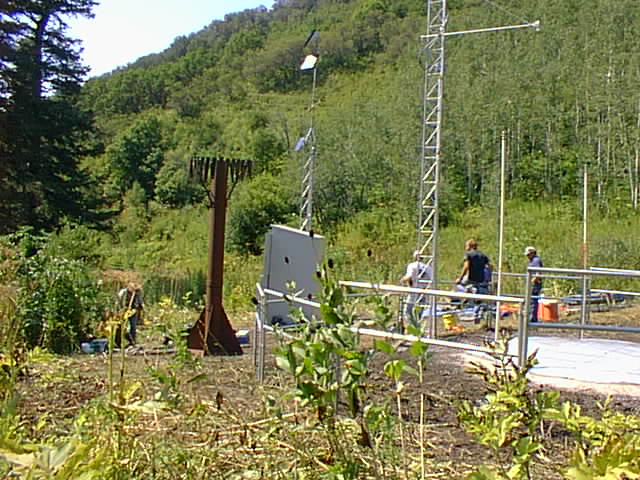
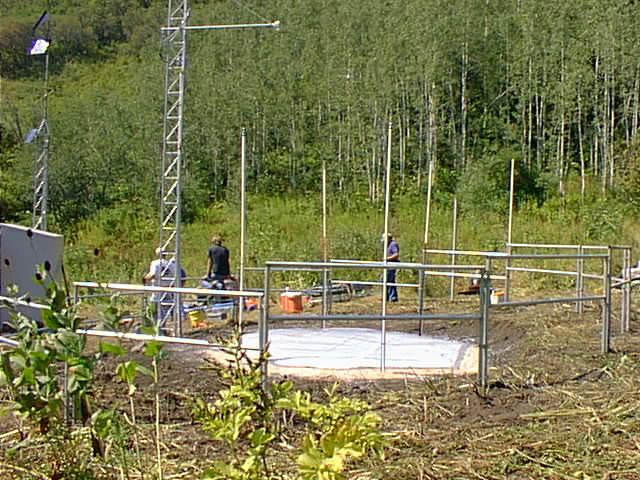
Sonic depth sensor, solar panels, etc
Since this system is truly remote (it�s a 2 day pack trip into Lakefork Basin at the foot of Mt Lovenia), all sites are self contained with batteries and solar power. In recent years, sensors have become much more reliable, electronics are becoming plug and play and the sites are much more stable. Data quality has always been good, but has increased substantially over the years.
As a system, SNOTEL, is the biggest provider of snowpack and high elevation climatic data in the world (and its only in the western United States!). This also indicates that there are very few other sources of data. The SNOTEL system, as of 2000, has about 650 sites in the Western US. Utah has about 85 sites. Daily historical data are available for SWE, PCP and TEMP.
DATA QUALITY
Oh ya Baby! We got data, we got data!, lotsa data! Check your guns at the door, young engineers: remember there are ALWAYS hidden gotcha's in the data! If possible, get the standards of site maintenance and data quality control.
PILLOWS
Remember, with pillows, we are NOT measuring snow water equivalent! (but,,, but,, but: you said just up here a page or two that we had snow water equivalent measurements! Yeah, right! I did and I LIED!) what we have is not snow water equivalent but WEIGHT! And weight and snow water equivalent are synonymous most of the time. However, just like a BYU Coed, weight can be more than it seems! There are other ways for weight to be transferred onto and off from the pillow system. Bridging occurs in a snowpack when an exceptionally strong snow layer (such as when freezing rain hits the pack and creates an ice layer several inches thick) supports the weight of additional snowpack on top of it. This creates an under-weigh condition on the pillow. Snow creep and glide exerts tremendous lateral and vertical pressure on a pillow system creating an overweigh situation.
Blowing snow can be re-deposited on a pillow system, again creating overweigh (in this case, manual and pillow measurements will be the same, but the data can be misleading, especially when compared to the precipitation data). Conversely, snow can be scoured from a pillow area, leaving less snow and a similar comparison problem.
Pillows exhibit diurnal data fluctuations that are most likely due to temperature changes and barometric pressure fluctuations. These cycles are typically in the range of +0.2 to -0.2 inches per day but on really lousy sites, may range up to 0.5 inches. Some sites are rock solid and display very little variability. Bottom line: if you compare similar time frames (i.e. midnight data to midnight data or noon data to noon data) you will most likely get good relative differences. Comparing midnight pillow data to noon pillow data may give over or under differences depending on circumstances.
Current snowfall is very light compared to the static weight of a seasons accumulation on a pillow. Snow has structure and typically bonds well with the pack beneath it. It may take some time for the full weight of new snow to be transmitted to the pillow sensor below - thus hourly pillow data may not be entirely reflective of the amount of new snow that actually fell during the time frame in question.
The good news is that pillows for the most part, behave very well. They respond reasonably quickly to new snow as well as melting snow. They exhibit some quirks that, for the design purpose of the system are more than acceptable. They have some limitations that data users need to be aware of, that might limit the extent of usability (for example modeling on a time scale finer that 1 hour or, depending, finer than 3 hours)
There are distinct differences in the way steel pillows behave as compared to hypalon pillows. Steel pillows are far more susceptible to data fluctuation. They typically are smaller in total areal extent of measure and are usually installed in patterns of 2,3 and 4 to a site. Changing a pillow system from steel to hypalon typically constitutes a 'change in sensor' and thus, a change in the current record as opposed to the historical. Most areas are phasing out steel in favor of the more stable hypalon pillows. The majority of the historical data record is from steel pillows.
Other pillow problems: since they have fluid, they always have the potential to leak. They are shot, stabbed, poked, prodded and violated in more ways than can be discussed in open civil dialog. They appear to be giant water beds surrounded by the loving, gentle sounds and sights of nature, inspiring the passions of who knows how many decadent nature lovers! In reality, they are cold, lifeless, scientific instruments of hydrometeorological data collection and are intended solely and singularly for that purpose only.